Monthly Archives: April 2013

April Already 4th Wettest on Record

Based on preliminary data, this April in Illinois is already the 4th wettest on record with 6.58 inches of precipitation. Average statewide precipitation for April is 3.77 inches. So we are already almost two inches above average.

According to the NWS forecast, more rain is expected across southern Illinois on Friday and Saturday. Therefore, it is possible that we will move up the list by the end of the month. In addition, some sites may have already reached their record for April, including the city of Chicago.

Top 5 Wettest Aprils

  1. 2011 with 7.40 inches
  2. 1957 with 7.13 inches
  3. 1927 with 6.95 inches
  4. 2013 with 6.58 inches
  5. 1944 with 6.50 inches

Precipitation Pattern Across the State

Here is how the precipitation has been distributed around the state, based on our multi-sensor precipitation product, with the actual amounts and the departures from average. Many parts of central and northern Illinois have more than double their average April precipitation (shades of purple in the second map).

April precipitation in inches for the first 24 days of the month. Click to enlarge.

April precipitation in inches for the first 24 days of the month. Click to enlarge.

April precipitation as departures from average. Click to enlarge.

April precipitation as departures from average. Click to enlarge.

How Are Lake Michigan Water Levels?

Today I had a reporter ask if the recent rains and flooding in Illinois will benefit the low lake levels of Lake Michigan. It has helped.

First of all, the Illinois part of the Lake Michigan basin is relatively small and extends only a few miles inland (see first figure below). As a result, most of the rain that fell in Illinois in recent weeks ended up going down the Illinois River instead. However, as the 30-day multi-sensor precipitation map (second figure) for the Midwest shows, the heavy rains continued over the southern third of Lake Michigan as well as into the Michigan side of the Lake Michigan basin. Amounts in the those areas were as high as 6 to 9 inches in the last 30 days which is well above average.

As a result, we have seen water levels rise on Lake Michigan in April. The third figure below is from the US Army Corps of Engineers Detroit Office showing the status of all five lakes lat week. In the upper right hand corner is the plot for Lake Michigan-Huron. The blue line is this year, and the red line is last year. The blue dots are the forecast and the grey dots are the long-term average. You can see that the Lake Michigan lake level has risen by five inches since the beginning of April. You may want to click on the image to get the larger view or look at the original report, in a higher resolution pdf file, here.

The current forecast for Lake Michigan by the US Army Corps of Engineers, released in early April,  suggests that water levels will remain below-average for the next six months and will likely be just a few inches above the record levels.

Map of Lake Michigan drainage basin. Note how little of it extends into Illinois. Map from the Michigan Sea Grant at http://www.miseagrant.umich.edu/explore/about-the-great-lakes/lake-michigan/.

Map of Lake Michigan drainage basin. Note how little of it extends into Illinois. Map from the Michigan Sea Grant at http://www.miseagrant.umich.edu/explore/about-the-great-lakes/lake-michigan/.

Map of precipitation across the Midwest. Heavy rains fell across northern Illinois, over Lake Michigan, and into the state of Michigan. Map by the Midwestern Regional Climate Center.

Map of precipitation across the Midwest. Heavy rains fell across northern Illinois, over Lake Michigan, and into the state of Michigan. Map by the Midwestern Regional Climate Center.

Great Lakes Water Levels. US Army Corps of Engineers: www.lre.usace.army.mil. Click to enlarge.

Great Lakes Water Levels. US Army Corps of Engineers: http://www.lre.usace.army.mil. Click to enlarge.

Heavy Rains of April 18-19, 2013

Northern and central Illinois saw widespread heavy rains on April 18-19, 2013. As a result, widespread flooding occurred first at the local level and then along major rivers by the weekend. Last year we had the drought; this year we have what I’m calling the “anti-drought”.

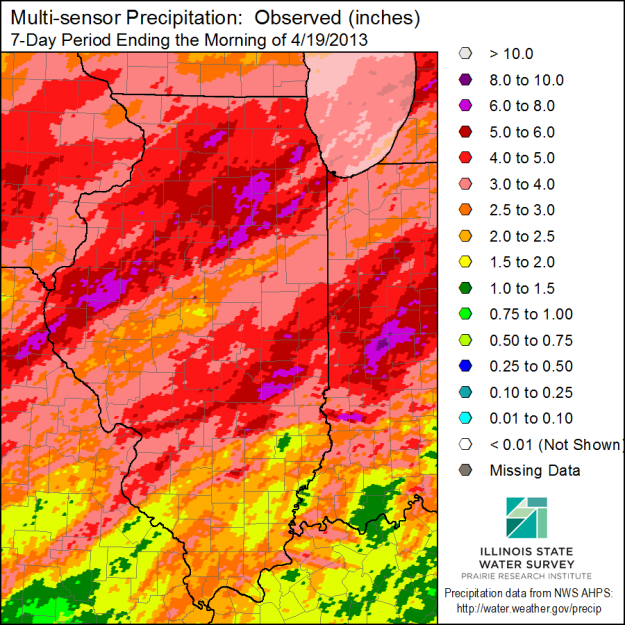
Below is the multi-sensor precipitation map for the 7-day period ending April 19, 2013. This map is based on radar-estimated precipitation and calibrated using available raingauges. Some of the heaviest rains fell north of a line between Quincy and Kankakee. Areas in purple reported between 6 and 8 inches, while the areas in the two shades of red were between 4 and 6 inches. Areas to the south of Interstate 70 escaped the heavier rains.

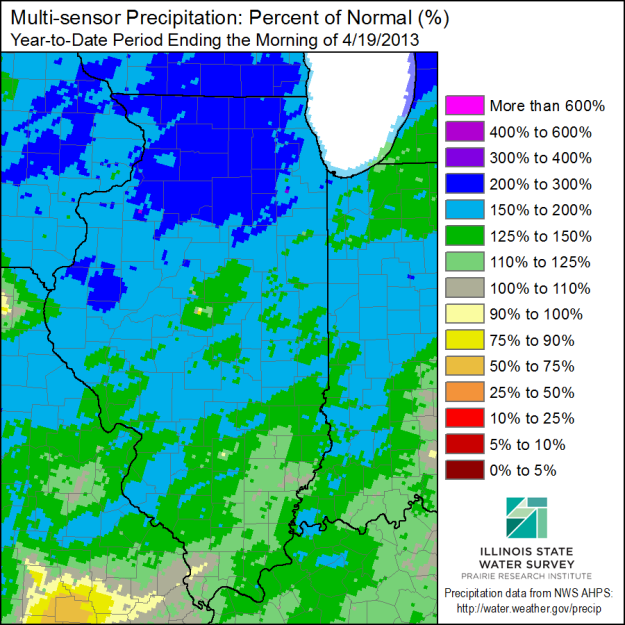
The second map is the precipitation situation for the year to date, expressed as a percent of “normal” or long-term average. The entire state is above average with the percentages getting larger (wetter) northward. In general, I would characterize the southern third of the state as being 110 to 150 percent of average so far. The central third of Illinois is between 150 and 200 percent of average and the northern third is between 200 and 300 percent of average.

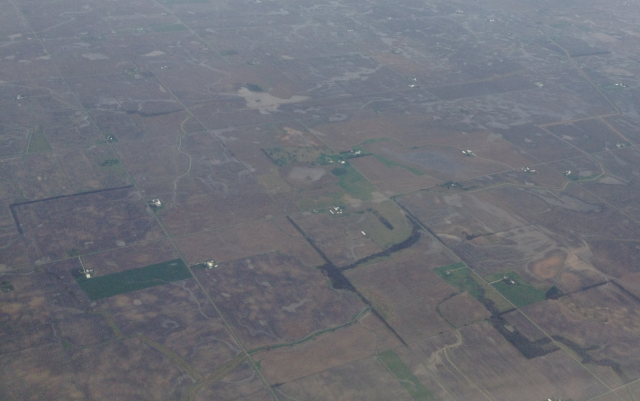
The last figure is a photo that I took on my commercial flight from Chicago to Champaign on Thursday afternoon, just after the worst of the rain had fallen. It is not the best photo in the world because it was gloomy, foggy, and the flight was rough. But it does show how saturated the fields were at this point.

IL-prcp-mpe-007-tot-20130419

IL-prcp-mpe-y2d-pct-20130419

photo

Picture of flooded farm fields somewhere between Chicago and Champaign Illinois on Thursday afternoon (April 18). It’s not the best picture in the world , but I took this out the window of the airplane while flying through moderate turbulence. You can see the water standing in fields and how small creeks were transformed into rivers. Click to enlarge.

Frost in Illinois

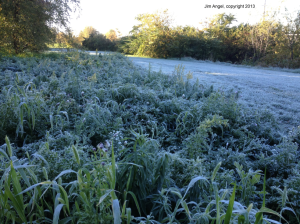
frost2For much of Illinois April is typically the last month that we see freezing temperatures until Fall (at least we hope). Below are the maps showing the median dates when we see 28 and 32 degrees for the last time in Spring. The median represents the middle value in the range of dates and is less sensitive than the average to unusually early or late dates.

We have more discussion and maps, including the earliest and latest dates of freezes during the 1981-2010 period on our frost webpage.

In addition you can track the status of this spring (2013) in terms of how things stand on hitting 28 and 32 degrees from the Midwestern Regional Climate Center.

Click to enlarge.

Click to enlarge.

Click to enlarge.

Click to enlarge.

60th Anniversary of the First Tornado Detected by Radar

Today is the 60th anniversary of the first documented case of a tornado detected by radar. Water Survey staff, at Willard Airport in Champaign, IL, captured the historic event on film on April 9, 1953. This discovery helped lead to the first national weather radar network in the United States.

The radar was located at Willard Airport, south of Champaign IL, and was being used along with a rain gauge network to relate radar signals with rain rates. Don Staggs, the radar technician, had stayed late to complete repairs on the radar. While testing the repairs, he noticed an interesting radar return and began recording the radar scope using the mounted 35 mm camera. As a result, he captured a well-defined hook echo on film. See photo below.  The hook echo is best described by the National Severe Storm Laboratory:

“hook echo” describes a pattern in radar reflectivity images that looks like a hook extending from the radar echo, usually in the right-rear part of the storm (relative to the motion of the storm). A hook is often associated with a mesocyclone and indicates favorable conditions for tornado formation. The hook is caused by the rear flank downdraft and is the result of precipitation wrapping around the back side of the updraft.


Afterwords, researchers related the radar data that Don recorded to detailed damage damage reports along the tornado’s path (see map and photos below).

I find this story fascinating for a variety of reasons. Some of the reasons are personal. It happened at my home institution (Illinois State Water Survey) and I knew several of the people involved (Don Staggs, Glen Stout, Floyd Huff, Stan Changnon). But beyond that there were several key ingredients to the story:

  1. The radar was on when it should have been off. If Don Staggs had not been working late to replace a piece of equipment on the radar, the discovery would have been missed. The storm occurred in the early evening hours when the radar was normally turned off.  Don had the foresight to keep the radar running when he saw the unusual return on the radar.
  2.  The tornado occurred near one of the few radars in the country at that time designed for weather research, as opposed to defense or air traffic control. There was no network of weather radars like we enjoy today. In addition, this radar set was equipped with a 35-mm camera to record what was on the scope.
  3. The thunderstorm was strong enough to produce a clear hook echo, and was located to the north of the radar so there was no attenuation (interference) from rain.
  4. The tornado was well-documented in terms of the location and timing of the damage. This allowed scientists to relate what happened on the radar scope with what happened on the ground.

The 1954 Water Survey report on the tornado stated, “It may be possible to establish radar storm warning systems in tornado areas to reduce loss of lives.” The April 9, 1953, event, along with subsequent events, helped provide the push in the US for developing a nationwide network of weather radars.
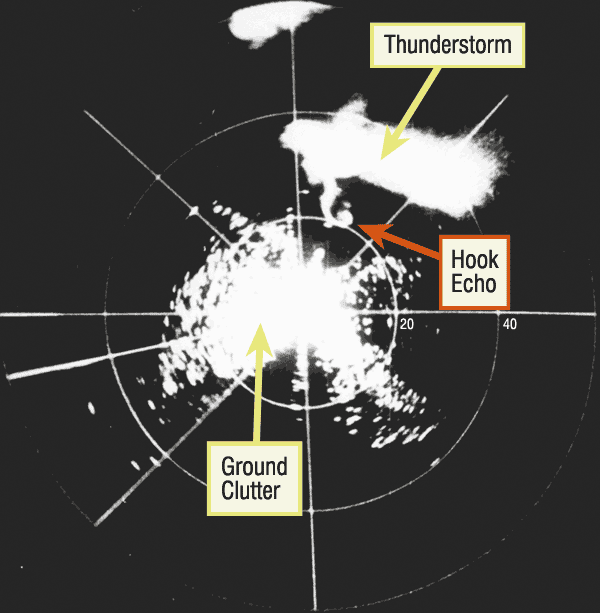
Radar hook echo
First recorded radar hook echo that was later associated with a tornado, April 9, 1953, near Champaign, IL. Photo by Illinois State Water, Prairie Research Institute, University of Illinois. 
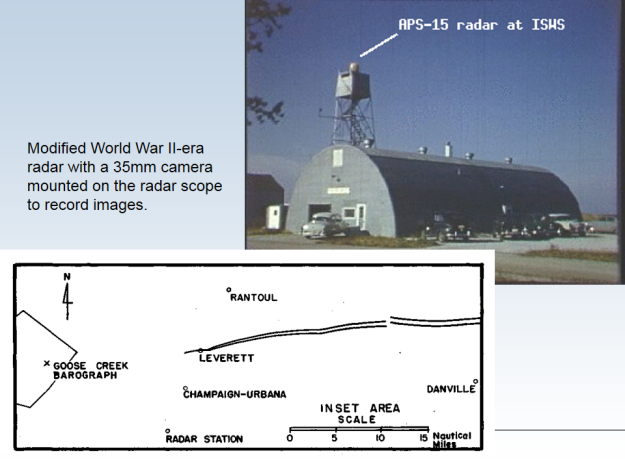
The radar site and track of tornado on April 9, 1953.

The radar site and track of tornado on April 9, 1953. The radar station is at the bottom of the map while the tornado passed north of Champaign-Urbana, Illinois. The radar was a highly-modified version of an airborne radar set from World War II.
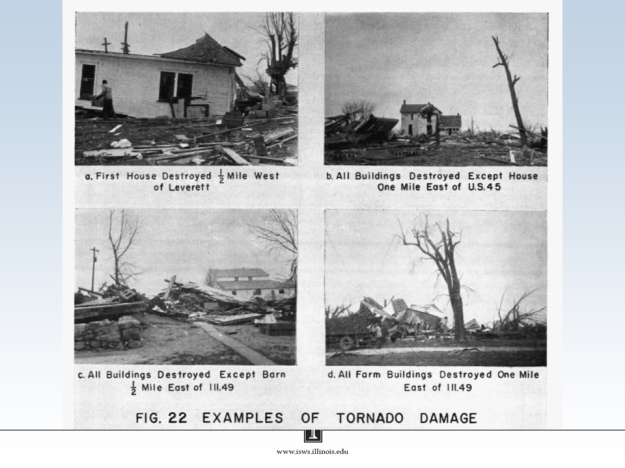
Damage caused by the April 9, 1953, tornado.
Damage caused by the April 9, 1953, tornado.

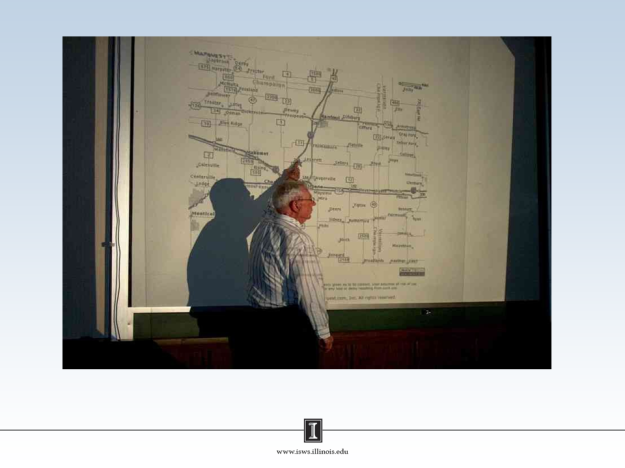
Don Staggs, recounting the events of April 9, 1953, at a talk on the subject about 10 years ago.

Don Staggs, recounting the events of April 9, 1953, at a talk on the subject about 10 years ago. I have known Don for many years – he is an excellent electrical engineer and a nice guy.

Additional information on this event: