Monthly Archives: January 2014

Eighth Coldest January on Record for Illinois

Temperature

Based on preliminary evidence, January 2014 was the eighth coldest January on record for Illinois. The statewide average temperature was 18.2 degrees, 8.1 degrees below the 1981-2010 average of 26.3 degrees. The statewide records go back to 1895.

Coldest January’s on Record

  1. January 1977: 10.3°F
  2. January 1918: 11.6°F
  3. January 1979: 12.9°F
  4. January 1912: 13.9°F
  5. January 1940: 13.9°F
  6. January 1978: 16.0°F
  7. January 1963 and 1982: 16.7°F
  8. January 1970, 1985, and 2014: 18.2°F

After being largely absent for the past two winters, below-zero temperatures were common in January 2014. For example, in Chicago the low temperature was zero or below on 13 days at O’Hare Airport. The low temperature was below freezing (32 degrees) every day of the month at Chicago.

Snowfall and Precipitation

Snowfall for January was above-average for most of the state, except far southern Illinois. Amounts ranged from 1-6 inches in far southern Illinois to 25-30 inches in northeast Illinois (getting a boost from lake-effect snow). The rest of the state saw snowfall totals in the 10-20 inch range. Chicago reported 33.5 inches of snow through Thursday, the third snowiest January on record. And it’s still snowing at the time of this report on Friday morning. The Chicago snowfall records go back to 1888.

The combination of the water content of the snow and a few rain events resulted in a state-wide precipitation total of 1.76 inches, which is just slightly below the long-term average of 2.12 inches. However, some areas of the state were below-average in January, especially south of Interstate 70 where winter-time precipitation is typically heavier than this year.

Snowfall (left) and snowfall departures from average (right). Click to enlarge.

map_btdmap_btd (1)

Windchill – Is It Serious Science or Hype?

On Sunday, January 26, the Chancellor of the University of Illinois sent an email to students and staff stating that the University would be operating on a normal schedule on Monday. A student petition was quickly created to protest, citing a NWS forecast of air temperatures below zero and strong winds producing wind chill values of -25°F to -35°F “which can cause frostbite within 10-15 minutes of exposure.” This incident has prompted me to make some comments about wind chill and its use.

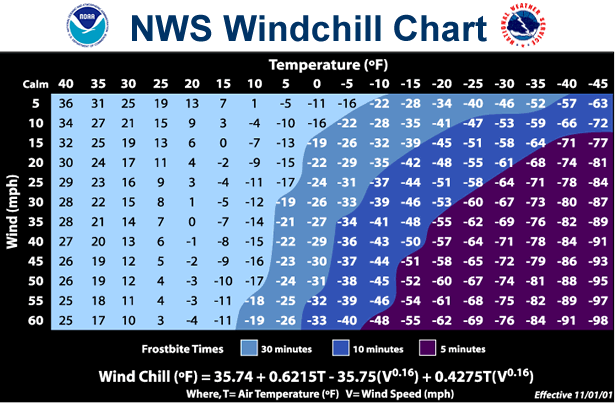
The National Weather Service defines the windchill as

The wind chill temperature is how cold people and animals feel when outside. Windchill is based on the rate of heat loss from exposed skin caused by wind and cold. As the wind increases, it draws heat from the body, driving down skin temperature and eventually the internal body temperature. Therefore, the wind makes it FEEL much colder. If the temperature is 0 degrees Fahrenheit and the wind is blowing at 15 mph, the wind chill is -19 degrees Fahrenheit. At this wind chill temperature, exposed skin can freeze in 30 minutes.

The first research on wind chill was based on how fast water froze in containers in the Arctic in 1939. The formula was revised in 2001 using more advanced models based on human skin.

While the latest version of the wind chill formula is a big improvement over the original, there are some important things to remember when considering wind chill:

  • Wind speed is highly variable. The calculations for windchill are based on wind speeds that are usually taken at the airport. While the wind speed is adjusted for the difference between the 33-foot wind instrument to the height of 5 feet, it is still based on winds at the airport in a wide open area. Areas in town with lots of mature trees may have significantly lower wind speeds. Conversely winds between tall buildings in downtown Chicago may be much higher. Therefore, the wind chill at a particular location may be much different from reported at the airport.
  • The wind chill formula is based on bare skin of a healthy adult – vulnerability to frost bite or hypothermia can be higher for the elderly and small children. On the other hand, covering bare skin and wearing appropriate clothing greatly reduces the effects of the cold and wind. Sunshine is not included in the formula even though it has the potential to moderate the effects of wind chill during the daylight hours.
  • An accurate wind chill forecast requires both an accurate temperature forecast and an accurate wind forecast. Anytime you have to rely on the combined forecast of two separate weather variables, in this case temperature and wind speed, the odds of getting them both right is reduced. For example, despite the forecasted dangerous wind chill values for the Champaign-Urbana campus on Monday, the actual temperatures during the daylight hours on Monday were in the single digits and wind chill values ranged from -17 to -10 degrees. And that was based on wind data from Willard Airport. While it was certainly cold on campus, the sunshine and lower wind speeds made it more bearable.
  • Does the wind really make it feel like minus 25? Despite the improved wind chill formula, I am still not convinced that the wind chill is an accurate measure of what the temperature “feels” like. I have experienced wind chill values in the -20 to -30 degree range on several occasions. However, I found that the actual air temperature of -25 degree on the morning of January 5, 1999, to be a far more unpleasant experience than wind chill values in that range.

I appreciate the desire to include more information about severe winter weather by incorporating the effects of low temperature and high winds. Certainly, the hazards of frostbite and hypothermia should be taken seriously. However, anyone using wind chill values to assess the risk of these hazards should consider the limitations described here. 

windchill

The Sudden Change of 1836 and 2014 in Illinois

One piece of weather lore in Illinois was the “Sudden Change” of 1836, which referred to a rapid drop in temperature on December 20, 1836. At the time Illinois was sparsely populated with few weather observation. The accounts of the time talk of a mild December day with the high temperature reaching into the 40s. On the horizon appeared a dark cloud, followed by strong winds, and a sudden drop in temperature. Some claim the temperature dropped from 40 degrees to -20 degrees in a matter of minutes!

That kind of temperature change seems a bit far-fetched. We do know that the weather observer for Augusta, IL, (west of Springfield) reported 40 degrees at dawn and 0 degrees at 2 pm on December 20, 1836. And what they describe sounds like a very strong low pressure system passed to the north of Illinois with a trailing cold front moving through the state, ushering in much colder air, high winds, clouds, and rain changing to snow. It sounds very similar to the conditions of January 26-27, 2014, in Illinois (I’m writing this on Sunday night as the wind howls outside).

Of course, this was long before there were accurate forecast or even the basic understanding of warm and cold fronts. It comes as no surprise then that several people perished during this sudden change of temperature. John and Sarah Power recount some incredible hardships in the 1876 “History of the Early Settlers of Sangamon County, Illinois”.

One account told of two travelers, named Hildreth and Frame, who were caught out in the open as the cold front hit. By dark, with no house in sight and plummeting temperatures, they killed one of the horses, took out the entrails, and crawled inside the carcass as far as they could for warmth. By midnight, the horse was frozen so they attempted to kill the second horse. But someone dropped the knife and they couldn’t find it in the dark. By 4 am, Frame was in the advanced stages of hyperthermia and “sank down in a sleep from which he never awakened”. Hildreth continued on horseback the next day. After one family refused to help, others came to his aid in the afternoon. He ended up losing most of his toes and fingers to frostbite.

One of the more humorous accounts was about a man named Crowder who was riding into Springfield to get a marriage license. He met the strong cold front about halfway to town. The water and slush on the road turned to ice in a matter of 20 minutes. Once in Springfield, he “attempted to dismount, but was unable to move, his overcoat holding him as firmly as thought it was made of sheet iron. He called for help, and two men come out, who tried to lift him off, but his clothes were frozen to the saddle, which they ungirthed, and then carried the man and saddle to the fire and thawed them asunder.” He made it back in time for the wedding on the 21st.

Many other stories were told of the sudden warming of 1836, such as two men frozen as they stood – one holding the reigns of a horse and the other kneeling as to start a fire. I’m sure many of these were embellishments of real and imaginary events. However, I am equally sure that many humans and animals suffered and perished during this sudden change.

In closing, we can now talk about the “Sudden Change of 2014” which was probably comparable to the 1836 in terms of the meteorology. However, in 2014 we benefit from better forecasts, warmer houses, and better modes of transportation than horseback. Be safe and stay warm.

How Cold Is This January in Illinois?

How cold is this January in Illinois?

Based on preliminary data, the average temperature statewide is 20.0 degrees. That is 6.3 degrees below average and ranked as the 17th coldest January on record. Of course, if the forecast holds for the rest of January, we would end up colder. Here is a list of the 20 coldest monthly average temperatures in January. The column marked “Temperature” is for the January statewide temperature and the column marked “Departure” is for the departure from the 1981-2010 average of 26.3 degrees.

See how many you remember.

Rank Year Temperature Departure
1 1977 10.3 -16.0
2 1918 11.6 -14.7
3 1979 12.9 -13.4
4 1912 13.5 -12.8
5 1940 13.9 -12.4
6 1978 16.0 -10.3
7 1982 16.7 -9.6
7 1963 16.7 -9.6
9 1985 18.2 -8.1
9 1970 18.2 -8.1
11 1936 19.4 -6.9
12 1904 19.5 -6.8
13 1905 19.6 -6.7
14 1930 19.7 -6.6
15 1895 19.8 -6.5
16 1994 19.9 -6.4
17 2009 20.3 -6.0
17 1962 20.3 -6.0
19 1924 20.8 -5.5
20 2010 21.1 -5.2
20 1929 21.1 -5.2

NOAA Outlook for February and Beyond

The NOAA Climate Prediction Center (CPC) released their latest outlooks for the month of February and for 3-month periods beyond that. I posted the maps below. You can see more detailed maps on their website. The February outlook for Illinois is indecisive or neutral – equal chances (EC) of above, below, and near-average temperature and precipitation.

The February-April outlook for temperature in Illinois is EC as well. The only interesting feature is an area in southern Illinois with an increased chance of above-average precipitation.

These forecast have traditionally had low forecast skill in Illinois, especially for precipitation. Right now the problem is that there are no strong force of nature in place like El Niño or La Niña to help guide the forecasts. At this time, the Climate Prediction Center states that we will likely not see either El Niño or La Niña into the Northern Hemisphere summer 2014.

page2