Tag Archives: soil moisture

USDA Soil Moisture Report for Illinois

Yesterday, the USDA released their report on soil moisture conditions for Illinois. Overall the state looks moist, especially in southern Illinois after weeks of rain. Statewide, 95 percent of the topsoil moisture and 93 percent of the subsoil moisture is rated as either “adequate” or “surplus”.

crop-soil

Continue reading

Tracking Illinois Soil Temperatures

As the snow turns to mud this week, this is a good time to advertise links for the soil temperatures in Illinois. The Water Survey operates a 19-station network of sites around the state collecting hourly soil temperatures at 4 and 8 inches under grass as well as an estimate under bare ground.

All this information can be found at the Illinois Climate Network Soil Data site. Below is just a screenshot of that page to show where you would find that information on the real web page.

map2

Here is a snapshot of 4-inch soil temperatures as of 10 am, March 13, 2015. Soil temperatures are still near the freezing mark in the northern half of the state, but warm into the 40s and low 50s in the southern half of the state.

map1

Halfway Through January

Back in the office after the first round of the 2014 Corn and Soybean Classics. There are two remaining dates, January 21 in Mt. Vernon and January 28 in Champaign.

It is no surprise that the first 15 days of January have been colder than average. The statewide average temperature for this period was 19.9 degrees and 3.9 degrees below the 1981-2010 average for this period.

While Illinois experienced some very cold temperatures, especially on January 6 and 7, very few records were broken. Here is a list of:

This list is not final as more stations will file reports at the end of the month.

The snowfall in January has been impressive so far. There was a large area across the state with 10 to 15 inches, mostly as a result of the January 5-6 winter storm (first map). Compared to the average for the first half of January, this January’s snowfall has been above average for almost all the state (second map). The largest departures from average were in central and eastern Illinois and ranged from 8 to 12 inches above average.

The statewide average precipitation (rainfall and the water content of any snow or ice) for the first 15 days of January was 1.48 inches and 165 percent of the long-term average for this period.

Probably some of that moisture has made its way into the soils if they have thawed out. We have 4-inch soil temperatures across the state and they have been in the mid-30s across southern Illinois and parts of central Illinois for some time now. So it is likely that the frost depth is less than 4 inches in most of those areas.  I did see a lot of water ponded and frozen in low-lying areas of fields across much of northern Illinois this week as those soils are more deeply frozen.

Most of the rivers and streams across the state are in better shape now than they were a month ago, especially across the central part of the state. Check out the USGS streamflow reports.

map_btd

snow-depart

Dryness Continues Across the Corn Belt

What a change in fortunes. After the wettest January-July on record in Illinois with 29 inches and 9.5 inches above average, we are now facing exceptionally dry conditions in the last 30-45 days across much of Illinois as well as the Corn Belt.

As the map of precipitation percent of average since July 1 shows, a large part of the Corn Belt is running at less than 50% (shaded dark orange to red).  Until recently we saw few impacts on crops because of cooler-than-average temperatures and the excess of soil moisture at the beginning of July. But all that is beginning to change. Warmer weather has returned this week and is expected to continue for at least the next 14 days, according to the NWS.

The soil moisture reports from the USDA NASS indicate that soil moisture is beginning to run low. Topsoil moisture a month ago was rated at 16 percent short and 0 percent very short. Monday’s report rated it at 50 percent short and 11 percent very short.

Subsoil moisture a month ago was rated at 9 percent short and 0 percent very short. Now it is rated at 35 percent short and 8 percent very short.

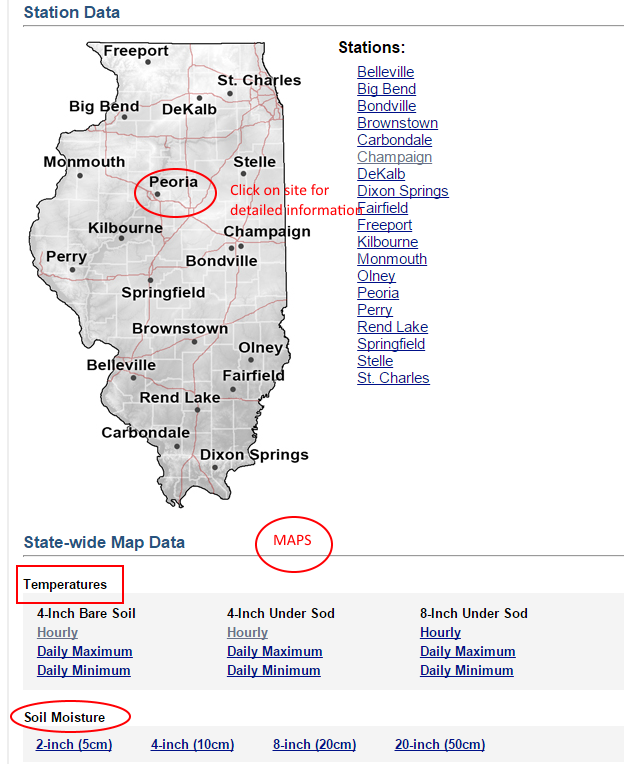
The Illinois State Water Survey reported lower soil moisture levels at their sites.

The one bright spot in the forecast is that there is a chance of rain in the next five days (second map). However, the potential amounts are modest. Northeast Illinois could see between 0.5 and 1.0 inches. The rest of the state is more likely to see 0.5 inches or less.  If the forecast holds, parts of Iowa, Minnesota, and Wisconsin could see some relief from the current dry conditions.

image

30-day precipitation percent of average for period ending August 21, 2013, based on radar and rain gauge data. Click to enlarge.

p120i

5-day potential precipitation amounts from the NWS, August 21, 2013. Click to enlarge.

Abnormally Dry Weather Creeps into Western Illinois

The latest US Drought Monitor has an area of “abnormally dry” conditions in western Illinois. This does not mean drought but it means that it is an “area of interest” to paraphrase what they say on TV when they have suspicions about someone but have no hard evidence.

In this particular case, the only evidence are widespread watering in towns and stressed corn and soybeans – especially the late planted fields with shallow root systems.

Rainfall amounts in those areas have been small and widely scattered (second figure). For example, Quincy airport has received only 0.25 since July 1. Combined with the high rates of evapotranspiration in July, roughly two-tenths of an inch per day, this situation can lead to the rapid withdrawal of topsoil moisture. Other areas in north-central Illinois may be candidates for the “abnormally dry” status in coming weeks if the rains do not return.

il_dm

IL-prcp-mpe-030-dev-20130724